Plot column means and confidence intervals
Usage
plot_cis(
  d,
  barflag = FALSE,
  newflag = TRUE,
  xvals = NULL,
  rgbvec = c(0, 0, 1),
  ...
)
Arguments
- d
A matrix of numerical data
- barflag
Flag indicating whether a barplot is desired
- newflag
Should new plot be generated, default T
- xvals
Vector of x values equal in length to number of columns in d
- rgbvec
Vector of red, green, blue proportions
- ...
Other graphical parameters
Value
Invisibly returns matrix of column means and 95% confidence intervals
Details
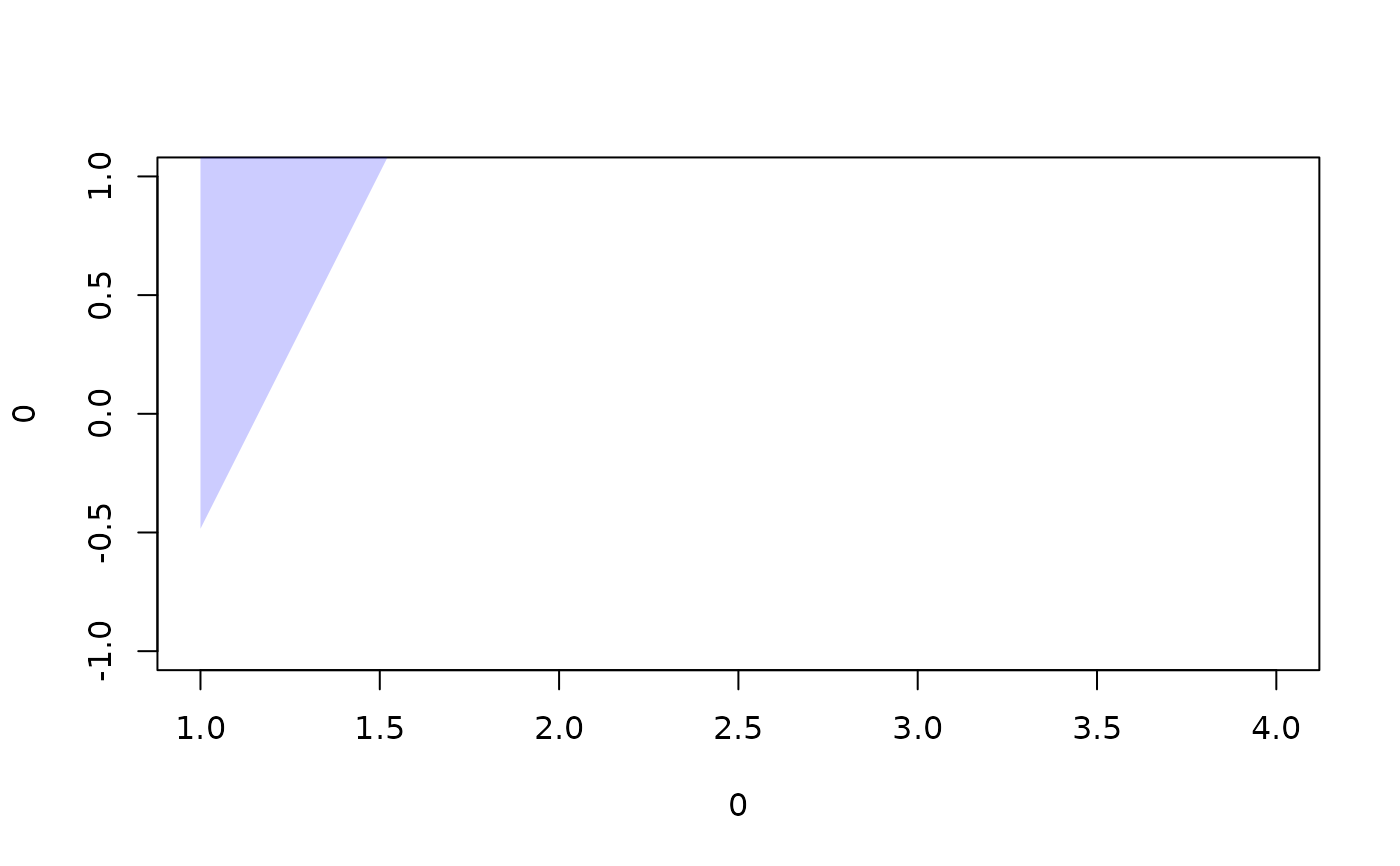
This function computes the mean and 95% confidence intervals of each column
in d and plots these either as a line plot with a transparent ribbon
(default) or as a barplot.
Examples
x <- matrix(c(1:12),3,4)
plot_cis(x)